Introduction
Single-cell transcriptomics is a technique that uses polyT-containing oligonucleotides to capture mRNA from individual cells, allowing for the interpretation of transcriptomic information at the single-cell level. Unlike conventional RNA-seq, single-cell transcriptomics can reveal the hidden characteristics of each cell. With the innovation of biological technologies, single-cell sequencing technology has evolved from high-cost, low-throughput to low-cost, high-throughput, with a single capture of up to 10,000 cells. It can be used for cell type analysis, immunology research, stem cell research, inter-cellular heterogeneity analysis, and developmental biology research.

BD Rhapsody(基于microwell的原理)
Platform advantages
Lower cost: Targeted gene detection avoids the large amount of sequencing data occupied by housekeeping genes, greatly saving sequencing and analysis costs;
Higher detection rate of rare transcripts: Targeted custom panels select specific gene combinations to improve UMI counting efficiency and lower the detection threshold for rare transcripts;
Ultra-high cell capture efficiency: Up to 79%, far higher than all current large-scale single-cell transcriptomics technologies on the market;
Overcome PCR amplification bias: Introducing the single-cell sequencing gold standard, BD molecular tags, to reduce nonspecific expression;
Achieve higher resolution: Can distinguish more fine-grained and microscopic cell groups and cell subtypes;
Ultra-long stable storage of reverse-transcribed beads: Complete cDNA can be stored in magnetic microsphere structures for up to 16 weeks, ready to use;
Flexible sample combination: In a single experiment, AbSeq kit can not only improve sample throughput (up to 12 samples can be built at the same time, and can be divided equally or randomly); but also can simultaneously perform single-cell protein and transcriptomics joint detection, greatly reducing costs while also providing a more efficient platform for single-cell multiomics research.

Technique route

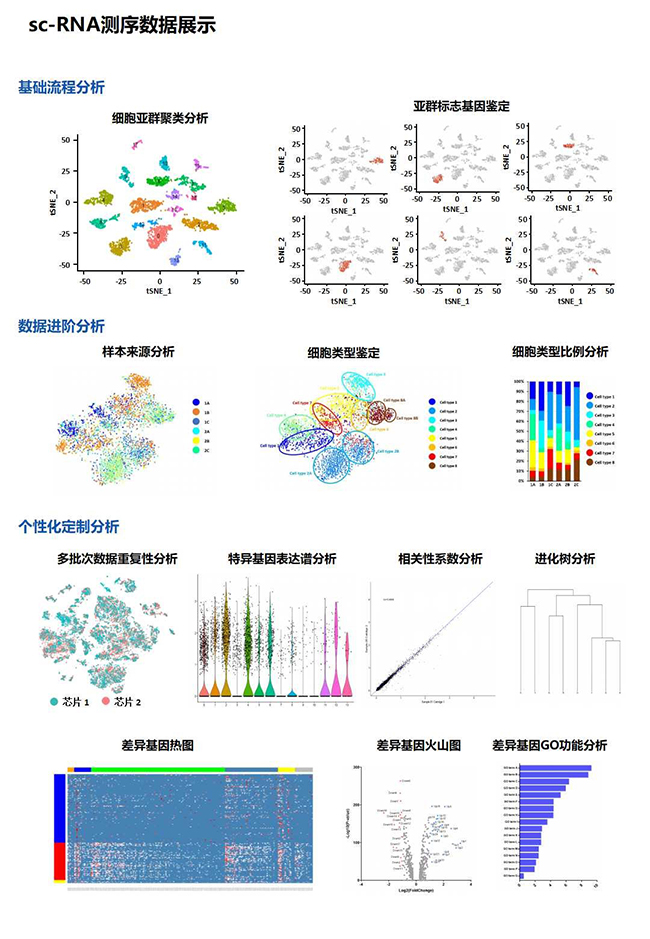
Single-cell research bioinformatics analysis

Sample requirements
Total > 104 target cell numbers (at least 10,000 cells)
Concentration 500-1,000 cells/uL
Cells are not sticky (cluster rate <5%)
No cell fragments or other particles larger than 40um
Cell viability should be greater than 80% (tested by trypan blue staining)
No reverse transcriptase inhibitors or non-cellular nucleic acid molecules
Regular project cycle
45-50 working days
References
1.Aizarani, N. et al. A human liver cell atlas reveals heterogeneity and epithelial progenitors. Nature 572, 199-204, doi:10.1038/s41586-019-1373-2 (2019).
2.Birey, F. et al. Assembly of functionally integrated human forebrain spheroids. Nature 545, 54-59, doi:10.1038/nature22330 (2017).
3.Fan, H. C., Fu, G. K. & Fodor, S. P. Expression profiling. Combinatorial labeling of single cells for gene expression cytometry. Science 347, 1258367, doi:10.1126/science.1258367 (2015).
4.Azizi, E. et al. Single-Cell Map of Diverse Immune Phenotypes in the Breast Tumor Microenvironment. Cell 174, 1293-1308 e1236, doi:10.1016/j.cell.2018.05.060 (2018).
5.Zheng, C. et al. Landscape of Infiltrating T Cells in Liver Cancer Revealed by Single-Cell Sequencing. Cell 169, 1342-1356 e1316, doi:10.1016/j.cell.2017.05.035 (2017).
6.Young, M. D. et al. Single-cell transcriptomes from human kidneys reveal the cellular identity of renal tumors. Science 361, 594-599, doi:10.1126/science.aat1699 (2018)

